Site History
Versions 1 and 2
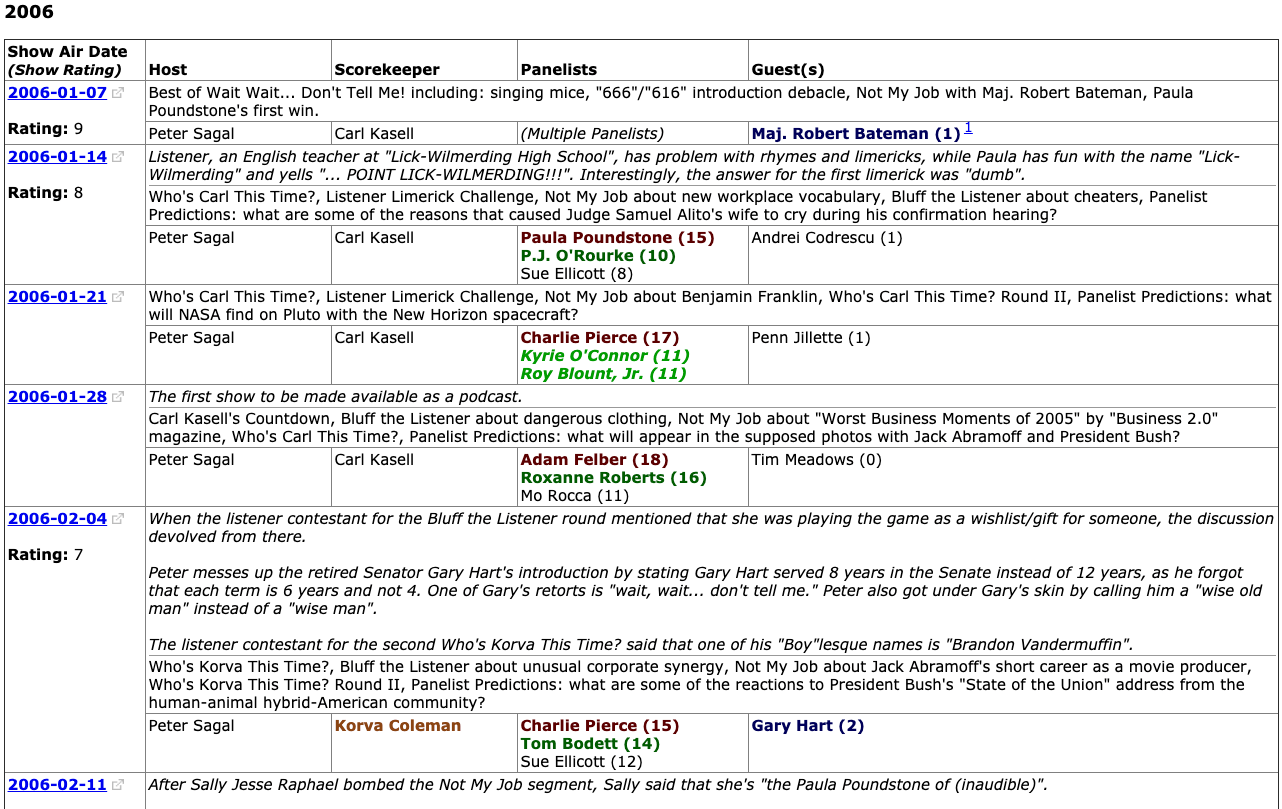
Although I started to regularly listen to Wait Wait... Don't Tell Me! in 2005, I didn't immediately start taking notes until some time later in 2006. While the NPR site would include details about each show's segments, guests and panelists, they didn't keep track of any scores or how many times a panelist appeared on the show.
Eventually, I would start collecting that information in a small notebook; but, I lost it after an office move or one of several cleaning sprees. So, the idea of storing the data in a database and creating a frontend for that came up.
I decided to build the site using PHP and use MySQL for the database as I already had a web server at home that hosted my website, written in PHP, and had a MySQL database server running on another server. After a couple months of work during my spare time, I published the first version of the site at the end of July 2007.
Version 2 of the Stats Page was an evolutionary update to the site with the addition of more detailed panelist statistics and a pair of graphs showing how well each panelist has done.
Version 3
The name "Stats Page" was pretty apt for the first two versions of the site, due to the fact that everything was presented on a single web page. As more features and details were added, along with the number of shows, the single page design made became unwieldy from both a user experience and a programming standpoint.
Thus, I postponed adding new features to the site until I could sit down and do a complete overhaul of the site. Since PHP was still my go-to language at that point, I decided to go with the Silex micro-framework as the foundation for the new site. This allowed me to create a very rudimentary MVC design and create views for each of the core items: shows, guests, hosts, panelists and scorekeepers.
Another key requirement that I had for the new version of the site was to make it more mobile-friendly. At that time, I went as minimalistic as possible when it came to the design and in terms of not requiring the use of JavaScript. I would only make use of JavaScript later to create interactive panelist graphs.
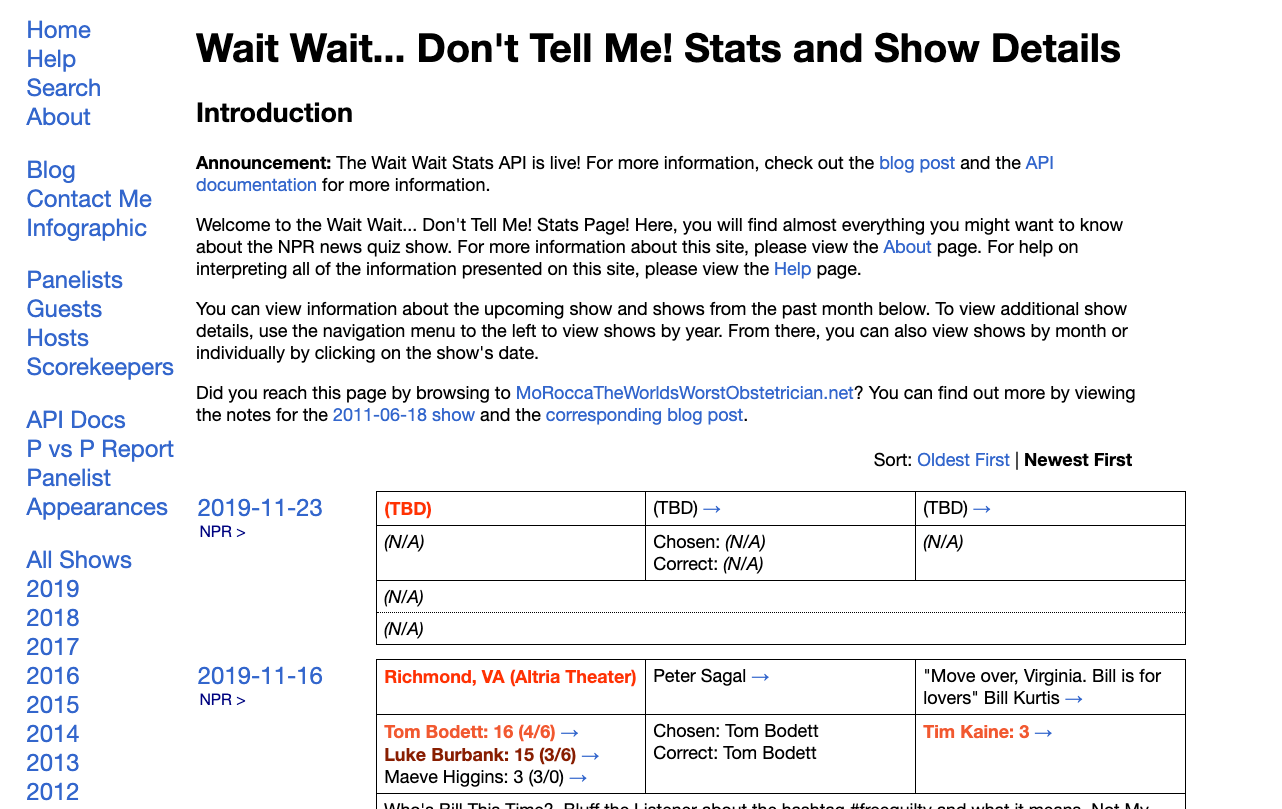
After a long-ish development process, the new version of the site launched in 2014. Since then, people have asked for additional features and analysis of the data that I've collected. I was able to add the introductions that Bill Kurtis would use to describe himself at the start of the show and started to keep track of Bluff the Listener data.
Version 4
As I continued to do more data analysis and field requests that I would get, there wasn't a clean way to add those to the Stats Page. Between that and the real need to extend and redesign the Stats Page for a more modern and responsive web landscape, I decided to build the next version of the Stats Page from scratch again.
By building the site from scratch again allowed me to move away from PHP and actually code in the language that I really loved and had started to get back: Python. I had been already been using Python for projects at work and with some of the Wait Wait data analysis requests.
The development of the Stats Page actually started with the creation of a data access library, libwwdtm. That data access library would be used as the foundation for the Stats Page and for the Wait Wait... Don't Tell Me! Stats API . The source code for both are released under the terms of Apache License 2.0 and are available on Codeberg: libwwdtm | api.wwdt.me .
For the Stats Page itself, it had to be mobile-first and maintain a minimalist design. For the frontend, I picked the Materialize frontend toolkit, and Flask and Jinja would handle the backend. To keep things as simple as possible, I limited the frontend customization to only CSS overrides.
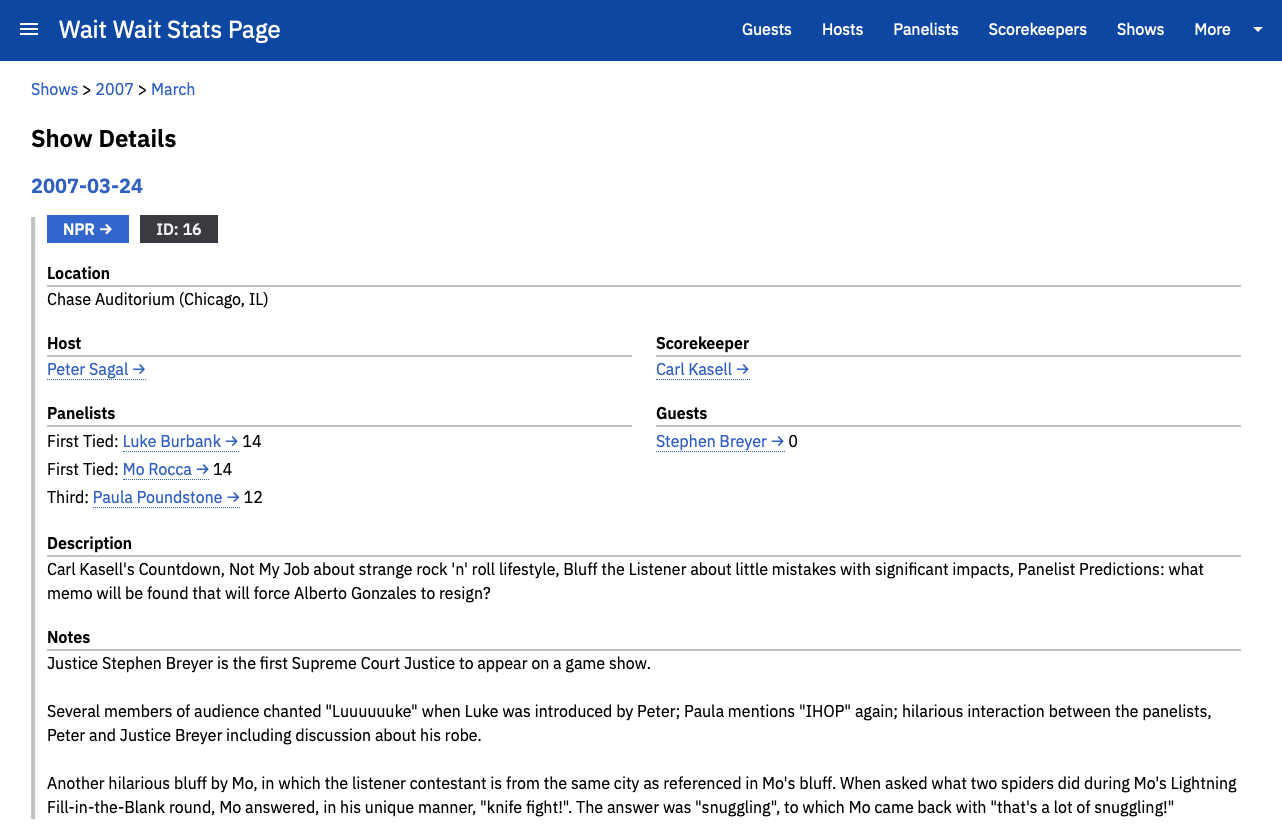
While most of the features of the Stats Page made it over to the new version, a few changes and omissions had to be made. The first change is the omission of the panelist scoring graphs due to need to completely overhaul them to be mobile-first. Those graphs will eventually be made available via the Wait Wait... Don't Tell Me! Reports site.
Another change is that going to the guest, host, panelist, scorekeeper and show views will only provide a list of the respective items. Most will provide a link at the bottom to get a full detail view of all items. This was done to reduce overall clutter.
Version 5
Version 5 brings two behind-the-scenes changes: switching to Version 2 of the Wait Wait Stats Library (wwdtm ) and making use of Flask Blueprints to make the application code more modular and easier to maintain.
While neither of those changes translate to anything visible in the site's frontend, the Materialize version was bumped from 1.0.0 to 1.1.0-alpha. Even though it is an alpha release of the framework, it does fix some issues and also includes some security fixes.
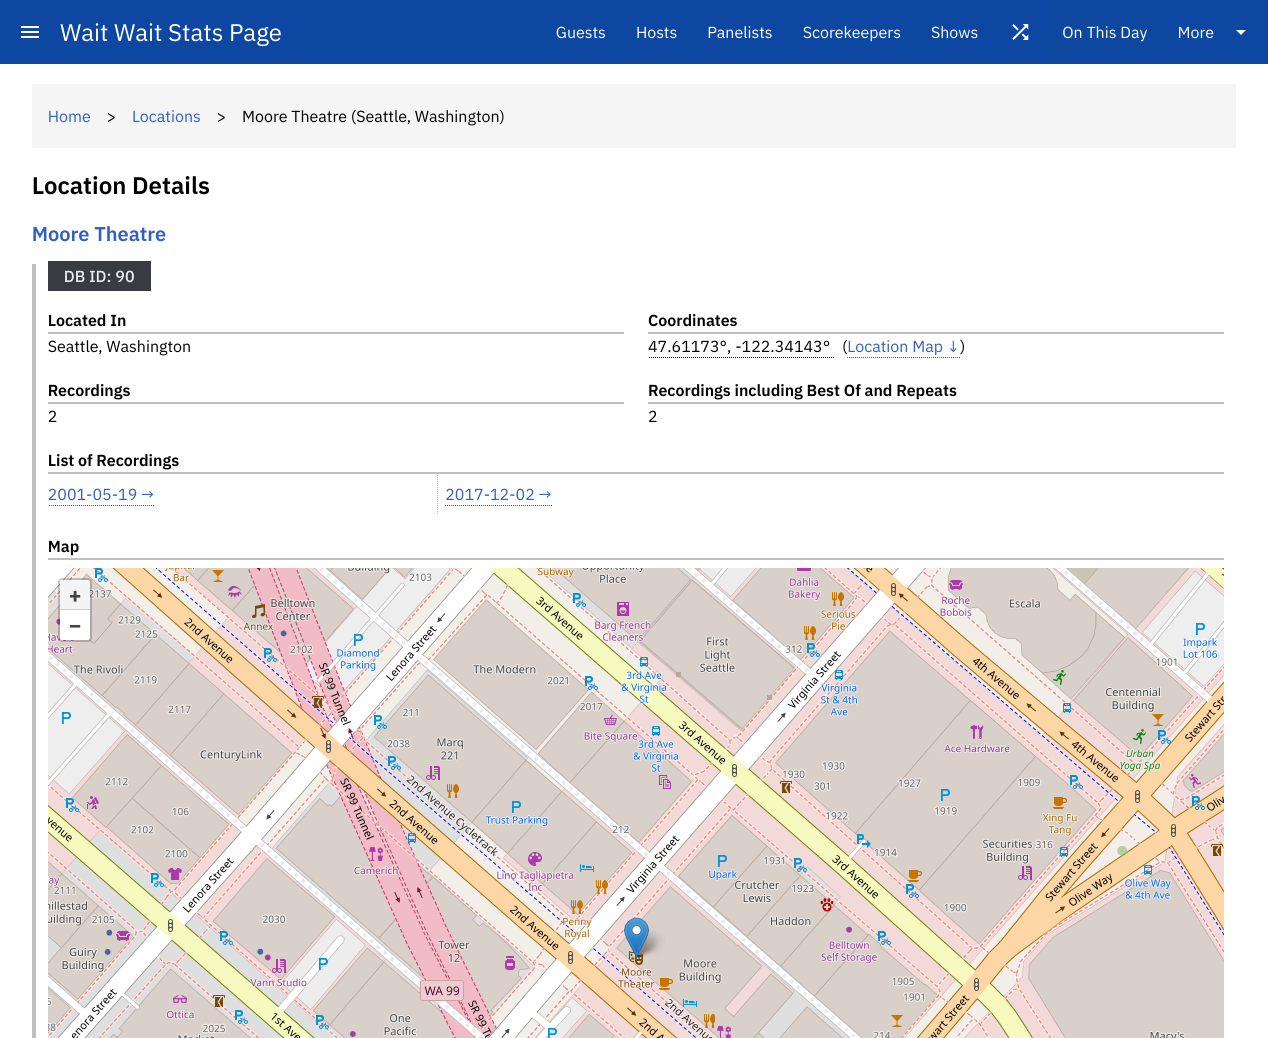
After I was able to get access to the Wait Wait shows that aired in 1998 and 1999, shows from 1998 had multiple Bluff segments, which required adding support for multiple entries in the Stats database and in the Stats Page. A feature that that been requested and had been sitting in the queue for some time was to add a location map in the location details page. This was done using Leaflet and OpenStreetMap .
Version 6
Back in April 2023, the folks who forked the original Materialize frontend toolkit announced an alpha of the upcoming version 2.0. Unfortunately, there were a lot of breaking changes in the new version that would require a refactor for the Stats Page frontend. I started to look at other toolkits and started to try out Bootstrap and Bulma . Fast forward to several months ago, I decided to use Bootstrap 5 to build a proof of concept to see how difficult it would be to replace Materialize with Bootstrap.
While testing out different designs and customizing the color themes and overall styles, I decided to use the color palette as defined in IBM's Design Language across the site. If I'm already using IBM Plex fonts for the site, using IBM's design language and color palette seemed to make some logical sense.
Switching to Bootstrap also gave me a chance to improve the site's accessibility, legibility and readability. The new dark mode color theme has increased contrast between the light text on a dark backgrounds. I have also added ARIA attributes to different user interface components and improving the use of semantic HTML and structure of each page.